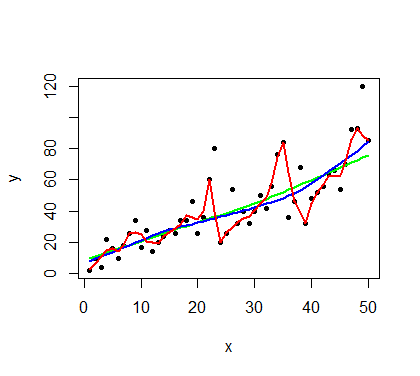
y <- cars$dist x <- 1:length(y) plot(x, y, pch = 20) lines(lowess(y~x, f = 0.9), col="green", lwd=2) lines(lowess(y~x, f = 0.5), col="blue", lwd=2) lines(lowess(y~x, f = 0.1), col="red", lwd=2) |
Details: https://youtu.be/zPafVva9BwE
y <- cars$dist x <- 1:length(y) plot(x, y, pch = 20) lines(lowess(y~x, f = 0.9), col="green", lwd=2) lines(lowess(y~x, f = 0.5), col="blue", lwd=2) lines(lowess(y~x, f = 0.1), col="red", lwd=2) |
Details: https://youtu.be/zPafVva9BwE